
- Home Stretch , Research
- 05/09/2019

Home Stretch | Establishing river courses
The course of a river can change a fair bit over time, and as a result the residents of river islands and deltas face serious dangers. Doctoral candidate Willem Sonke produced software that allows experts to chart rivers with greater accuracy and to better predict the risks.
People have traditionally been drawn to rivers, benefitting from them as transport routes and sources of drinking and other water. But rivers are by no means unchanging: under the influence of natural processes like erosion, the deposition of sediment, extreme weather and climate change, river courses are in flux. Banks crumble away or accrete, and river islands (‘banks’) move about or flood at irregular intervals, with all the consequences you would expect for the people living there. Just think of the devastating floods that occur every couple of years in Bangladesh's densely populated delta.
To be able to predict which (inhabited) river islands are at risk, and to be able to work effectively with strategically sited dams and bank reinforcements, a better understanding of the geophysical processes that cause a river landscape is required. The risk of flooding is not the only issue here, the effect on nature of work like dredging shipping channels also has to be considered.
“In the Westerschelde estuary, for example, the impact of dredging the shipping channel to Antwerp is measured every year by Rijkswaterstaat, theoretical information scientist Willem Sonke tells us. “According to the experts, if the main shipping channel is too deep it causes the rest of the Westerschelde estuary to silt up, which has adverse consequences for the ecosystem.”
So where then is the best place to deposit the dredged sediment? This is a question the Utrecht professor of Geomorphology Maarten Kleinhans is trying to answer, and in his capacity as a doctoral candidate Sonke lent his research group some assistance. The team in Utrecht had been establishing the course of rivers by drawing them by hand onto satellite pictures, he explains. “That is a lot of work and, what's more, it is not really an objective method. So Kleinhans got in touch with my supervisor Bettina Speckmann and asked whether we could come up with an algorithm.”

Braided rivers
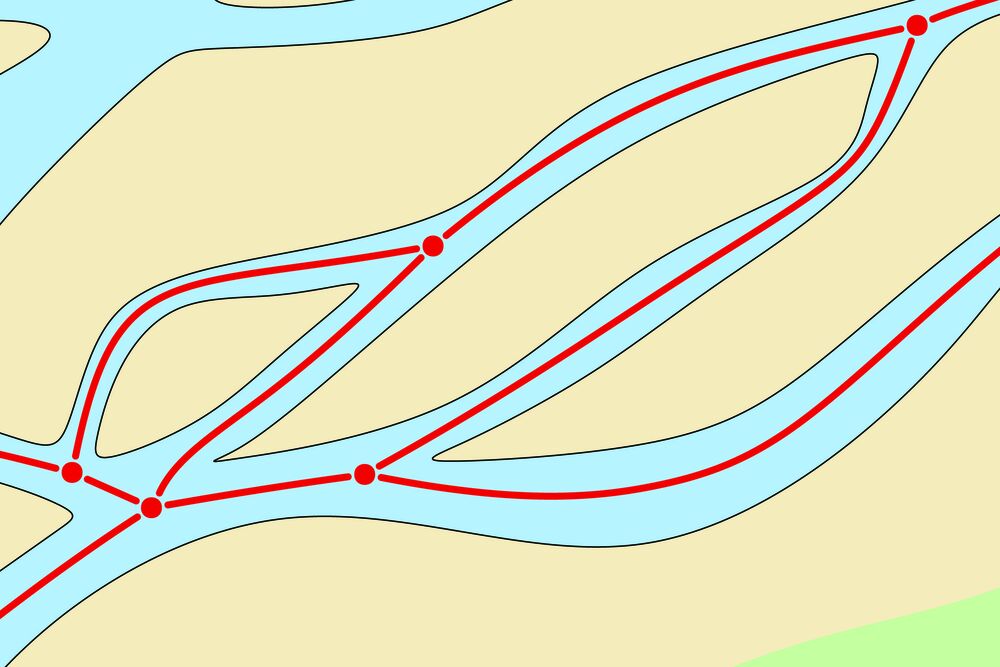
Two situations are particularly difficult to chart automatically, according to Sonke: braided rivers (whose branches repeatedly converge and split, thus creating a complex geometry of streams punctuated by islands) and estuaries (where a river fans out before flowing into the sea). Yet this is a necessary step if their evolution over time is to be tracked.
“For drainage networks by contrast, where you are looking at how rain or melt water runs downhill, it was possible to draw the streams automatically and predict where the rivers would run based wholly on a digital elevation map,” Sonke explains. “But this required the assumption that water always takes the steepest downward route, and that precludes the option of a stream splitting itself into smaller steams, which is why this method cannot be used for a braided river or the Westerschelde estuary.”
Sonke wrote software that the Utrecht-based group could use to draw the course of the Westerschelde estuary and the Waimakariri, a braided river in New Zealand. In addition, he produced a simplified model designed for tracking the changes in such rivers over time. He refers to the project as a good example of how as a theoretical information scientist you can contribute to work in other fields. As an illustration, he has pleasant memories of the week he spent programming in Utrecht. “Right after every step I got feedback on why something didn't work, and at the end of the week I had something that solved their problem. That's really satisfying.”
Discussion