
- The University
- 25/02/2026

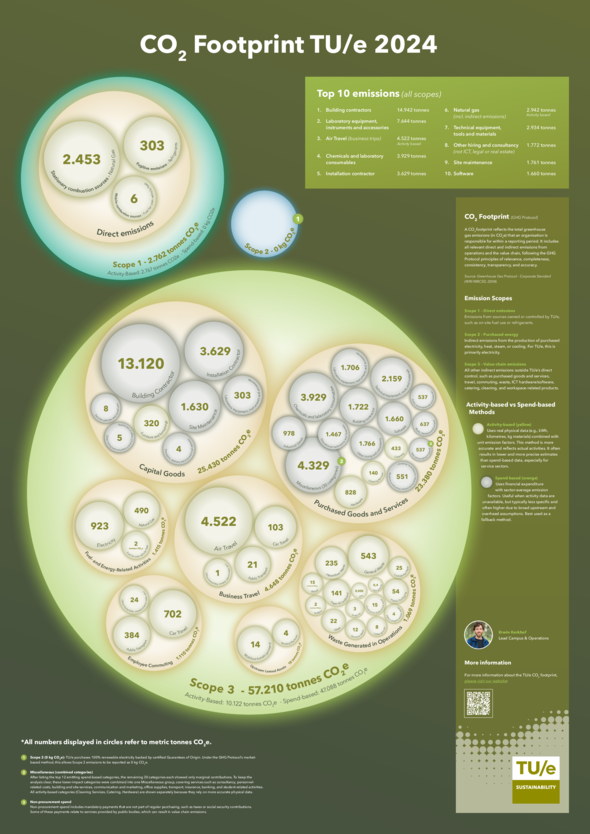
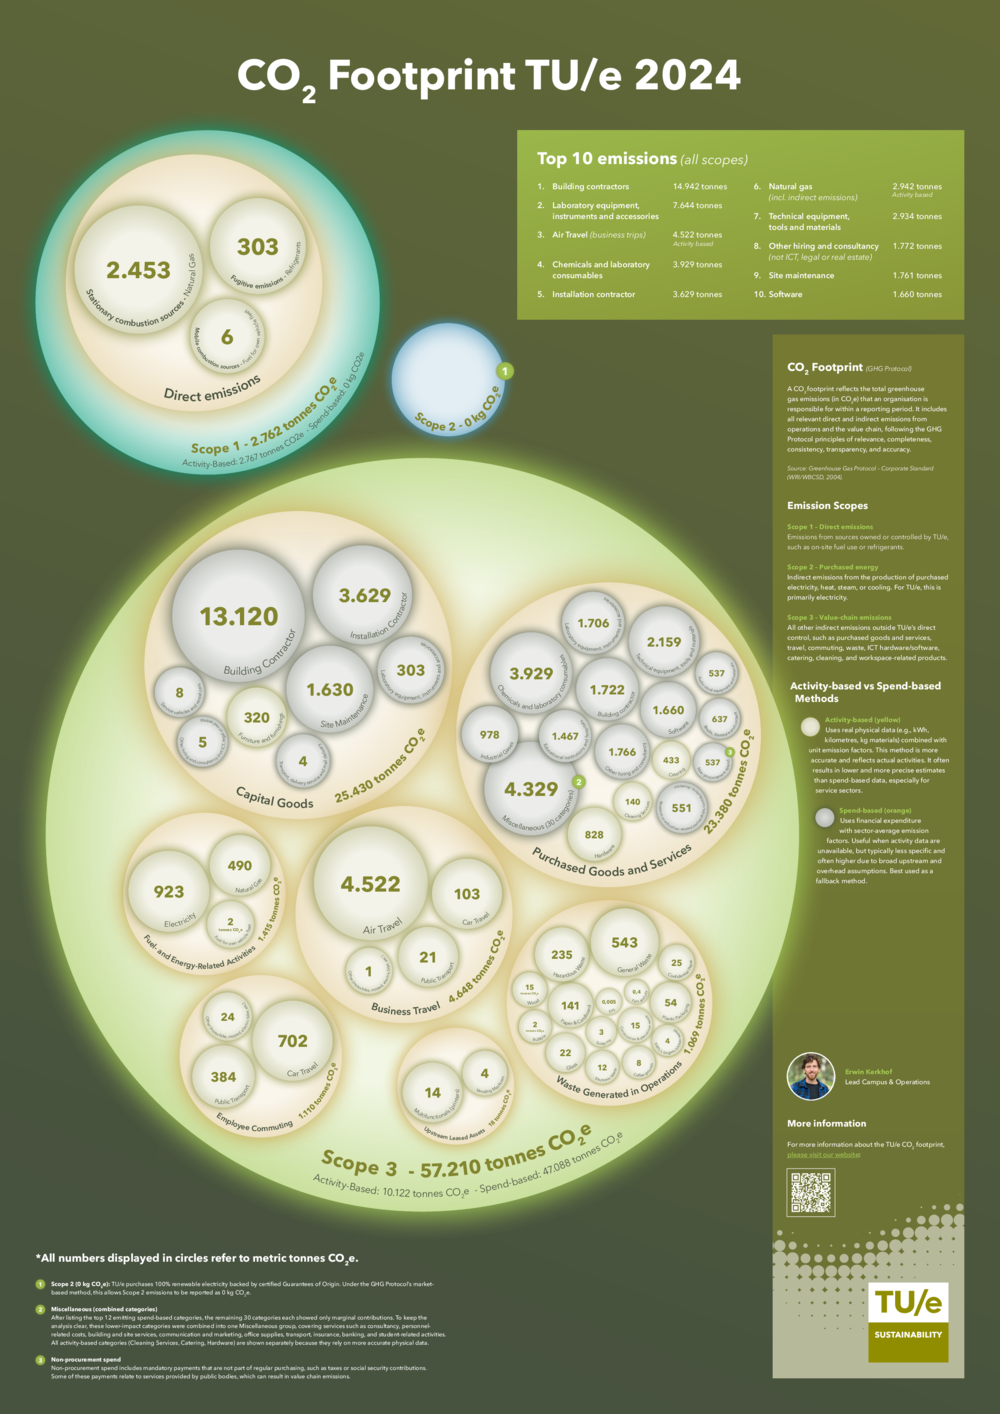
Research reveals: this is TU/e’s carbon footprint
From catering to air travel: how much CO₂ does TU/e emit – directly or indirectly – when you take everything into account? For the first time, the Sustainability Office has mapped the university’s complete carbon footprint. Last Tuesday afternoon, they presented the results during a walk-in lunch, highlighting the ten largest sources of emissions.
“We wanted to get an impression of how much CO₂ we actually emit,” says Erwin Kerkhof from the TU/e Sustainability Office, the project leader. Over the past year, he and his team have worked to calculate the 2024 emissions as accurately as possible. “We’ve tried this before, but never on such a comprehensive scale.”
Three scopes
Behind him, the results are displayed on a screen in the Go Green Office. The many circles – from small to large – represent different emission sources and are divided into three categories. “These are the three emission scopes: 1, 2, and 3,” Kerkhof explains. “Scope 1 is what you emit directly on campus, such as gas for heating, fuel for TU/e cars on campus, or refrigerant from air conditioning systems.”
Scope 2 covers emissions from the energy you purchase, such as electricity from a power plant. “For us, this is zero, because we’ve been using green energy on campus since 2024.”
The largest bubble is scope 3. “This represents indirect emissions: CO₂ emitted elsewhere, but for our benefit,” Kerkhof says. “Think of catering – this includes emissions from meat production or transport, which happen at the farm.” Scope 3 also includes TU/e’s procurement, such as ICT services or furniture, as well as all employee travel, from commuting to business flights.
Quite a task
To collect all the data, the team had to request a lot of information from the procurement department – quite a task, since it involved spending on a variety of services, from ICT to catering and cleaning. “You need to know things like: how many laptops were purchased? How much cleaning product was used? And how many kilos of meat were consumed?”
“This kind of data, which you can derive directly from purchases or usage, is called activity-based,” Kerkhof explains. “These are the numbers we know for sure.” Unfortunately, not all data is available. For instance, Gemini-Noord and the Sports Center were recently renovated, but the exact emissions are unknown – for example, how much concrete or steel was used. “For this, we use a spend-based calculation: we estimate the emissions based on the money spent.”
Working group
Other universities are also working on mapping their emissions. There is a national working group of different universities that aims to make emissions comparable. “It’s not easy, because you need to ensure that the same calculation methods are used; there are different ways to do it,” Kerkhof says.
You also have to decide how to convert total emissions into a ratio: do you base it on the number of students, employees, campus size, budget, or something else? “We are now looking at this together in the working group, because we believe that a fair comparison can provide interesting insights.”
Largest emitters
Based on the collected data, the team identified the ten largest sources of emissions. Number one is dominated by campus renovations and new construction. “This mainly comes from the use of materials like steel and concrete,” Kerkhof explains. More frequent reuse of materials and increased use of biobased materials could significantly reduce CO₂ emissions.
Second place goes to laboratory equipment and instruments. “We were surprised by how much emissions this category generates.”
Third place is air travel – all business flights. This is not entirely surprising, but its total share in the overview is quite notable. “Unfortunately, we don’t have exact data, because TU/e doesn’t track the number of flights,” Kerkhof notes. The figures are therefore based on data from the University of Groningen, which does keep track, and then adjusted proportionally to the number of employees.
A crucial starting point
Kerkhof hopes the results will show where the greatest gains can be made in the short term. “For example, we often talk about making catering more sustainable, while those emissions are relatively modest compared to other categories. These numbers put everything into a different perspective.”
At the same time, he emphasizes that it remains important to continue making all categories more sustainable, regardless of whether their emissions are relatively small or large. “When it comes to catering, sustainability also involves animal welfare, health, and biodiversity — issues that are equally important.”
For policymakers, the findings of the study provide valuable information that can guide future green initiatives. Kerkhof also stresses the importance of first better mapping the categories for which accurate figures do not yet exist. “It’s quite remarkable that TU/e has no data on the number of flights, while that causes so much emissions,” he says. “You need to know your emissions first. Then you can see how, for instance with a flight policy, you can reduce those emissions – and afterwards measure whether it works.”
Kerkhof sees this first full carbon footprint as a crucial starting point. “It’s a baseline measurement. We plan to continue this in the coming years, so we can track the steps we’ve taken and where there’s still room for improvement. The ultimate goal is to reduce CO₂ emissions by 95% by 2050. That will be a huge challenge,” he concludes.
This article was translated using AI-assisted tools and reviewed by an editor
Discussion