- Research
- 08/09/2025

Home Stretch | Making complex DNA accessible at a glance
Astrid van den Brandt develops interactive visualizations for complex genetic information
How can you make the genetic diversity of plants, bacteria, and viruses easier to understand? TU/e PhD candidate Astrid van den Brandt has developed interactive visualizations that help researchers to better understand complex genomes. This week, she will defend her thesis at the Department of Mathematics & Computer Science.
Van den Brandt has a background in industrial design, but discovered a new passion during her master's degree in Data Science. In the visualization group, she discovered how creativity and analysis come together: “Visualization helps to make data transparent, identify problems, and form new hypotheses.” For her PhD, she wanted to apply those skills to biological data. Together with Wageningen University and plant breeding companies, she worked on ways to make plant DNA data more transparent.
A challenging aspect was that she had limited knowledge of biology at the time herself. “During the first year, I had to brush up on a lot of biology. That was tough, but also insightful.” Simultaneously, she also sees an advantage: “That outside perspective can cause you to view things slightly differently, and notice things that someone long established in the field might overlook.”
A genetic library
“The genetic instructions of every organism are encoded in its DNA,” Van den Brandt explains. These are special molecules that carry hereditary information. The complete set of genetic information of a single organism is called the genome. In practice, this is nothing more than a very long string of the four building blocks A, T, C, and G. DNA sequencing is used to read this code and record it digitally. This is how a molecule from the lab is transformed into data that researchers can compare, search, and visualize to better understand which genes are involved in certain traits and how these vary.
A pangenome goes one step further: it encompasses not only the genetic code of a single organism, but of multiple individuals within the same species or even of related species. In this way, a pangenome clearly shows genetic variation. Until recently, DNA samples were often compared to a single reference genome, but that does not always yield the best results. “With a single reference, you often miss important information,” Van den Brandt says.
You can think of a genome as a book, with each chapter representing a gene that contributes to a particular trait, such as eye color or disease resistance. A pangenome is like a collection of books on the same theme, a kind of genetic library that maps the natural variation within related individuals and species. This provides a more realistic and complete picture of genetic diversity, but the data is also much more complex. “Without good visualization, it is difficult to oversee exactly what you are looking for or comparing,” she says.
New visualization tools
Van den Brandt developed interactive visualization tools based on existing techniques that help researchers discover important patterns in complex genetic data. “The main goal is to enhance data exploration. For example, you can use these tools to sort or zoom in on data, allowing you to spot interesting differences or similarities more quickly.”
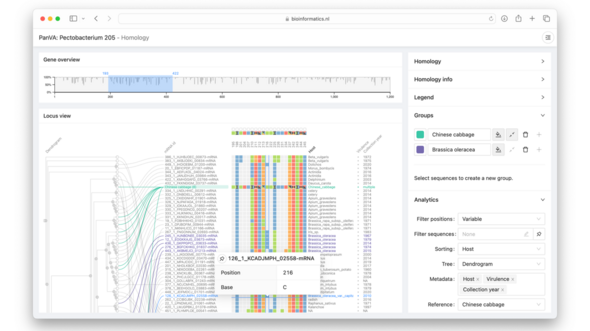
She emphasizes that the visualizations do not provide exact results, but are primarily a tool that can offer researchers an opening point, so they know where to start. “It helps you form a hypothesis, after which you can conduct further research using statistical analyses.” This makes large and abstract data sets transparent, revealing biologically relevant patterns.
From agriculture to vaccines
The methods are currently proof-of-concept, but the potential applications are promising. In agriculture, more targeted research into pangenomes could help make crops more resistant to disease by backcrossing traits from wild plants. "Due to climate change, it is also essential to make plants climate-proof, so they require less water or are resistant to warmer or colder climates, for example. "
In the medical sector, pangenome research can play an important role in precision medicine. This is an approach in which treatments are tailored to individual patients, for example based on their genetic profile. The idea is that medications and therapies will be more effective and safer because they are better suited to a person's unique characteristics. It can also help in the development of better vaccines that respond more specifically to the variation in immune responses between people. “In fact, wherever genetic variation plays a role, this can be useful,” Van den Brandt concludes.
PhD in the picture
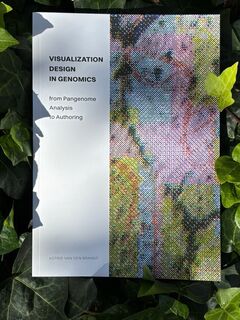
What is that on the cover of your dissertation?
Because a pangenome is very abstract, the illustration is too. It consists of several layers of bitmaps—digital images—that are interwoven. You can also see the double helix of DNA, the characteristic spiral shape of the molecule. The input for these layers consists of scanned plant leaves, zoomed in to the cell structure. In this way, the image is a metaphor for looking deeply into plants and all the information we study in the process.”
You’re at a birthday party. How do you explain your research in one sentence?
“I create data visualizations of plant DNA for applications in agriculture.”
How do you blow off steam outside of your research?
“When I'm doing research, I spend a lot of time sitting at my computer, so outside of work I try to exercise as much as possible. I enjoy running, cycling, and swimming.”
What tip would you have liked to receive as a beginning PhD candidate?
“An important skill I had to learn during the process was to tailor my language to the target audience. Within the project, I had to communicate extensively with various stakeholders, so I had to speak to all these groups in a way that ensured everyone understood each other, and I had to avoid using unfamiliar terms. For example, sometimes you give a presentation to the entire organization, and then it's essential that everyone can keep up with you.”
What is your next step?
“I will start as a postdoc in the United States in October. Due to all the recent developments, it was uncertain for a while whether it would happen at all, but it worked out. I will continue to work on visualizations of pangenomes, but then with genetic information from humans.”
This article was translated using AI-assisted tools and reviewed by an editor
Discussion